Community Risk Factors of Ebola
Towards the end of the 2014-16 Ebola outbreak in West Africa the American Red Cross together with its local partners extensively surveyed communities within a 15-kilometer distance of the shared borders between Guinea, Liberia, and Sierra Leone. The information from this survey continues to serve as a fireline for containment of the infection.
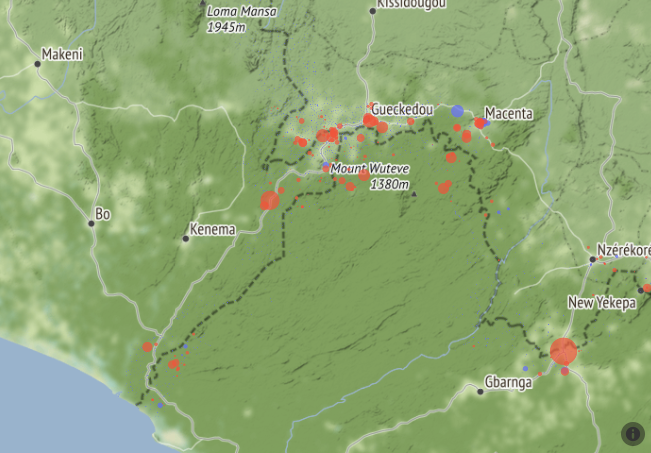
The maps below give an overview of the 7,200 communities surveyed. In the first map, each dot represents a community, with red representing a community that reported at least one case of Ebola during the outbreak.
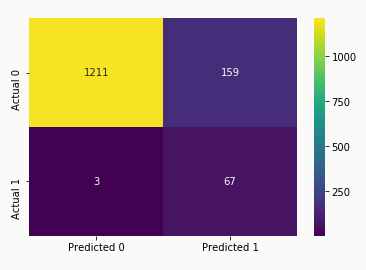
Model Metrics
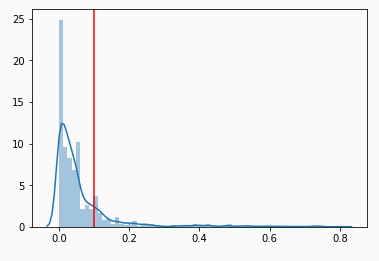
Recall / Precision Tradeoff
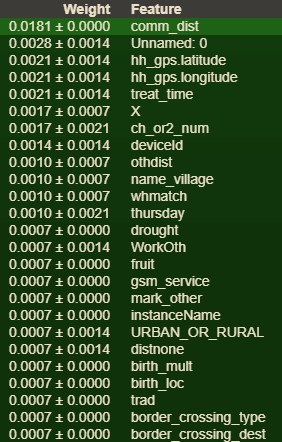
Predictive Factors of Infection
Shapley Values for Model's Worst Prediction
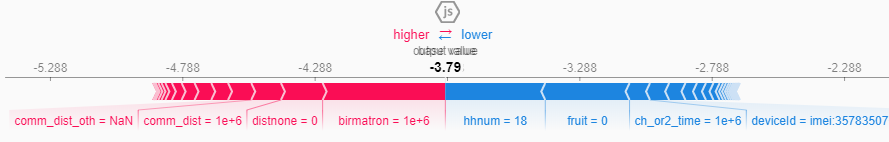 For the village of Peivalor, our model predicted only a 2.2%
probability of the community having any cases of Ebola. However, there was
in fact at least one unconfirmed case of infection.
Inspecting the plot above, the top two factors that decrease likelihood of infection are: (1) Peivalor is a
relatively small community of 18 households; (2) the local market does not sell
fresh fruit.
On the left hand side in red, the top factor that leads our model to predict an increased
infection risk was that the community had no person or facility designated for giving birth.
The next two biggest factors were interrelated. The member of the community surveyed specified that
there were other disasters experienced by the community during the outbreak, but the nature of the
coinciding disaster was either not disclosed or was not included in the report.
For the village of Peivalor, our model predicted only a 2.2%
probability of the community having any cases of Ebola. However, there was
in fact at least one unconfirmed case of infection.
Inspecting the plot above, the top two factors that decrease likelihood of infection are: (1) Peivalor is a
relatively small community of 18 households; (2) the local market does not sell
fresh fruit.
On the left hand side in red, the top factor that leads our model to predict an increased
infection risk was that the community had no person or facility designated for giving birth.
The next two biggest factors were interrelated. The member of the community surveyed specified that
there were other disasters experienced by the community during the outbreak, but the nature of the
coinciding disaster was either not disclosed or was not included in the report.
Shapley Values for Model's Most Certain Prediction
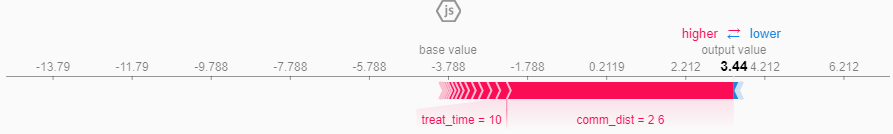 The village of Oremai was given the highest probability of infection at 97%. All
told, this village of 100 households experienced 4 cases of Ebola.
Most notable in the diagram, there simply does not appear to be very many
factors in this village's favor. The largest factor contributing to our model
predicting an infection in this community was that it experienced two major
disasters during the same time as the outbreak. The next largest factor was
the amount of time it takes for the average community member to get to and
from a treatment facility.
The village of Oremai was given the highest probability of infection at 97%. All
told, this village of 100 households experienced 4 cases of Ebola.
Most notable in the diagram, there simply does not appear to be very many
factors in this village's favor. The largest factor contributing to our model
predicting an infection in this community was that it experienced two major
disasters during the same time as the outbreak. The next largest factor was
the amount of time it takes for the average community member to get to and
from a treatment facility.